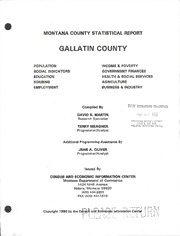
Gallatin County : Montana county statistical report PDF
Preview Gallatin County : Montana county statistical report
SECTION8:HEALTH&SOCIALSERVICES(cont'd) FeesperSection*: MONTANA TTaabbllee91:0:LPoubwliicnacsosmiesteannceergpyroagsrsiasmtsa,ncfei,schaelayteiangrsse1a9s8o9nsto11998987/89to1996/97 $5.00foreachsection. COUNTY Table11:Hospitalsandotherhealthcarefacilities,1988to1997 Forthesamesectionfrommultiplecounties,$5.00 SECTION9:AGRICULTURE percountythrough30;beyondthat,anyquantity( STATISTICAL REPORTS Table1: Ruralfarmpopulation,1980and1990 is$150.00 Table2: Farms,farmacreageandvalueoflandandbuildings,1982, 1987and1992 Table3: Sizeoffarms,1982,1987and1992 FeesperTable*: Table4: Farmlanduse,1982,1987and1992 Table5: Countyrankinthestate'sagriculture,1987to1996 Staterankinthenation'sagriculture,1987to1996(*) $25.00foronetable,whichincludesthesametable TTaabbllee76:: FFaaanrrdmm1s9ib9ny2commaerkaentdveaxlpueensoefsa,gr1i9c9ul0tutroal19p9r5oductssold,1982,1987 forall56countiesandthestate. Table8: F1a9r9m2sbymarketvalueofsalesbycommodity,1982,1987and ' Includesprocessingfee(photocopying,shippingand Table9: Farmoperators,1982,1987amd1992 telecommunicationcharges) Table10:Taxablevalueofagriculturalland,livestock,machineryand improvements,1988to1996 SECTION10:BUSINESS&INDUSTRY CEICWILLANNOUNCEUPDATESONA Table1: Financialinstitutions,1990,1992,1994and1996 PERIODICBASIS. THEFEEFORUPDATED TTaabbllee23:: ERemtpaliolytereasd,eepsatyarbollilsahnmednetsstwaibtlihsphamyernotlsl,by19i8n7duastnrdy,19199287to1994 TABLESIS$2PERTABLE. PREPAYMENTIS Table4: Retailtradeestablishmentsandsales,1987to1996 REQUIRED. Table5: Wholesaletradeestablishmentswithpayroll,1987and1992 Table6: Serviceindustryestablishmentswithpayroll,1987and1992 Compiledby TTaabbllee78:: MSearnvuifcaectiunrdiusntgryesetsatbalbilsihsmhemnetnstsbyanedmprlecoeyiepets,siz1e9,8719a8n7da1n9d921992 Feesforproductsandservicesareidenticalfor CENSUSANDECONOMIC (*)=TableappearsonlyintheStateofMontanavolume everyone. Toplaceanorder,pleasecall,faxor INFORMATION CENTER writetotheaddressonthefrontcover. AFederal PRICELISTANDORDERINGINFORMATION rTeaqxuiHr)ednufomrbaelrloorrdearsSo.ciMalASKecEurCitHyEnCuKmbSeris MONTANA D(CEEPICA)RTMENT OIF FeesperCounty*: PAYABLETOMTDEPT.OFCOMMERCE-- COMMERCE CEIC(PayableinU.S.Dollars).Pleaseincludea $25.00foreachcountyorforstateofMontana(a phonenumberincaseafollow-upcallisneeded. 1424NinthAvenue $7f0u0l.l0r0epfoorrtaoffutlelnsestubojfec5t7sreecptoirotnss,pwehriccohunintcyl/usdtaetse) CENSUSANDECOCONPOYMRIICGIHNTF1O9R96MATIONCENTER Helena,POMoBnotxan2a0055960210-0501 allcountiesandthestate (406)444-2896 http://commerce.mt.gov/ceic statrept.fly 2/10/98 MontanaCountyStatisticalReportsareacollectionof Table5: Publicschoolenrollmentbygrade,academicyears1990/91to Table5: Percapitapersonalincome:percentofnationalaverage,1980to cdastoneaudmtniosetgtayriccaashpnehodnifccfiootramsnptfdaihfsetssyositcsnaiitgxeo.etcceonSoununbtborijmeoeisacc.dtdsdaCuatlbtaijaeefnacotrtrsecthaahatvevaeeigslotaaartbcieleceseosfefsioMtrtohoeenratcbahyna • mTablTeI6O:N4Sy1:te9ua9dr6Hes/nO9t1U79eS9n0rI/oN9l1Glmteont19a9t6i/n9st7it(u*t)ionsofhighereducation,academic TTTTaaaabbbblllleeee9786:::: THiI1ronn9aucc9nsoo5semmfheeeorloodffpsahhyoowmuuiesstneehthhsoio,llnddcs1so^9mb9e1y09art7noa9dc1eam9nae9dn5ad1n9Hh8io9supsaenhioclodriignicno,me1,9819979and cinodmipvliedtuealsestecotfioanll(tpeonpusleacttiioonn,s.agTrhieculRteuproe,rtestca.)reourpadsataedona TTaaabbb!llee21:: OUcrcbuapnaanncdyrcuhraarlachtoeursiistnigcsunoiftsh,ou1s9i8n0gaunndits1,9910980and1990 TTaabbllee1101::MI1ne9c8ao9nmeinocfofmaemiolfiefsa,mi1l9i7es9bayndfa1m9i8l9ytypeandpresenceofown regularbasisasmorerecentstatisticsbecomeavailable. Table3: Structuralcharacteristicsofhousingunits,1980and1990 childrenunder18years,1989 Table4: Structuralcharacteristicsofoccupiedhousingunits,1980and1990 Table12:Incomeofnonfamilyhouseholds,1989 SECTION1:POPULATION Table5: Selectedcharacteristicsofoccupiedhousingunits,1980and1990 Table13:Incomeasapercentageofpovertylevelofpersonsforwhom Table6: Valueofspecifiedowner-occupiedhousingunits,1990 povertystatusisdetermined,1979and1989 Table1: Area,1990,andpopulation,1890to1990 Table7: Contractrentofspecifiedrenter-occupiedhousingunits,1990 Table14:Povertystatusofpersonsforwhompovertystatusisdeterminedby Table2: Componentsofpopulationchange,1980to1990 Table8: Mortgagestatusandselectedmonthlyownercostsfor ageandbygender,1989 TTaabbllee43:: CInecnosrupsoersataenddpilnatceersceannsdalceesntsiumsatdeess,ig1n9a7t0edtopl1a9ce9s6,1980and1990 Table9: Oscpcecuipfiieeddohwounseirn-gocucnuitpsieadndhohuosmineghuenaittis,ng1f9u8el0,a1n9d8109a9n0d1990 Table15:aPgoevearntdybstyathuosuosfehpoelrdsotnyspef,or19w8h9ompovertystatusisdeterminedby PopulationofMontanaanditsincorporatedplaces,1890to1990(*) Table10:Occupiedhousingunitsandavailablevehicles,1990 Table16:Povertystatusofhouseholdsbyhouseholdtype,1989 Table5: Populationbyage,1970to1990 Table11:Permit-authorizedconstructioninpermit-issuingplaces,1990to Table17:Povertystatusoffamiliesbyfamilytypeandpresenceofrelated Table6: PopulationbyraceandHispanicorigin,1970to1990 1994 childrenunder18years,1989 TTTaaabbbllleee789::: PPPooopppuuulllaaatttiiiooonnnbbbyyyaaagggeee,,,Hrriaaccseepaaannniddcggoeernnidgdieenrr:,an1pd9e9rg0ceenndtearg,es1,9910990 SECTION5:EMPLOYMENT SECTION7:GOVERNMENTFINANCES Table10:Populationbyurbanandruralresidence,1980and1990 Table1: Employmentstatusofpersons16yearsandolder,1980and1990 Table11:Persons,householdsandfamilies,1980and1990 Table2: Employmentstatusofpersons16yearsandolderbyraceand Table1: Selectedlocalgovernmentfinances,fiscalyears1982and1987 Table12:Populationprojections,1996to2020 Hispanicorgin,1990 Table1A:Selectedtotallocalgovernmentfinances,fiscalyears1982and Table13:Indianreservationsandtheircountyportions,1980and1990(*) Table3: Laanbdonrofoorwcnescthaitludsroenfufnemdaelres181y6eayresa,rs1a9n8d0oalndder1,9w9i0thownchildren TableIB:S1e9l8e7c(t*e)dstategovernmentfinances,fiscalyears1982and1987(*) SECTION2:SOCIALINDICATORS Table4: Annualaverageestimatesofthecivilianlaborforceand Table2: Federalfundsdistributedbyselectedexecutivebranchagencies, unemploymentrates,1980to1996 fiscalyears1988to1993 Table1: Birthratesanddeathrates,1980,1985,and1988to1996 Table5: Civilianlaborforceemployment,percentchangefromprevious Table3: Individualstateincometaxreturns,1990to1995 Table2: Livebirths,deaths,marriagesandmaritalterminations,1980,1985, year,1980to1996 Table4: Taxablevalueofproperty,1988to1996 and1988to1996 Table6: Occupationofemployedcivilianpersons16yearsandolder,1980 Table5: Propertytaxesleviedforallpurposes,1988to1996 Table3: Placeofbirth,1980and1990,andplaceofresidence,1985 and1990 Table4: Dteoa1t9h9s6anddeathratesbytenleadingcauses,1980,1985,and1988 Table7: Peexrpseornisen1c6eybeyarosccaunpdatoilodneranbdynroacweoarnkdeHxipsepraineincceo,ri1gi9n9,0withwork SECTION8:HEALTH&SOCIALSERVICES Table5: M1a9r9i0talstatusbygenderofpersons15yearsandolder,1980and nTable8: I1n9d9us0tryofemployedcivilianpersons16yearsandolder,1980and Table1: SocialSecuritybenefits:old-age,survivors,disability,andhealth Table6: Maritalstatusbygenderandageofpersons15yearsandolder, Full-timeandpart-timeemploymentbymajorindustry,1990to insurance(OASDI)beneficiariesbytype,ageandgenderof 1990 1995 beneficiaries,December1987toDecember1995 Table7: Militaryserviceofpersons16yearsandolder,1990 Table10:EmploymentandwagescoveredbyMontanaunemployment Table2: SocialSecuritybenefits:old-age,survivors,disability,andhealth Table8: Mobilityandself-carelimitationstatusbygenderandbyageof insurancelaws,1988to1996 insurance(OASDI)monthlycashbenefitsbytype,ageandgender Table9: Ccriivimliinaanlnoonfifnesntsietsutainodnaclriziemdepreartseso,ns191868yetoar1s9a9n6dolder,1990 TTaabbllee1112::PWloarcekodfiswaboirliktyofstwaotruskearnsd1e6mpyleaorysmeanntdsotladteurs,b1y98g0enadnedr1a9n9d0byage Table3: Soufpbpelneemfeicnitaarliesse,cuDreitcyemibnecorm1e9(8S7SIt)opDreocgermabme,rDe19c9e5mber1987to ofciviliannoninstitutionalizedpersons16yearsandolder,1990 December1995 SECTION3:EDUCATION SECTION6:INCOME&POVERTY TTaabbllee45:: HSteaatlet-hadimnisnuirsatnecreedfohrutmhaenagseedrvaincedsdpirsoabglreadms(,Mefdiisccaalrey)e,ar1s981598to91to996 Table1: Educationalattainmentofpersons18yearsandolderand25years 1997 andolder,1990 Table1 Personalincomebymajorsourceandearningsbyindustry,1990to Table6: Medicalassistanceprogram(Medicaid),fiscalyears1989to1997 Table2: Educationalattainmentofpersons25yearsandolderbyraceand 1995 Table7: FamiliesachievingindependenceinMontanaandaidtofamilieswith Hispanicorigin,1990 Table2 Totalpersonalincomebyplaceofresidence,inconstant dependentchildren,fiscalyears1989to1997 Table3: Schoolenrollment,educationalattainmentandemploymentstatusof 1992dollars,1990to1995 Table8: Householdsreceivingfoodstamps,fiscalyears1989to1997 persons16to19yearsbyraceandHispanicorigin,1990 Table3 Percapitapersonalincomeincurrentdollarsandpercentchange Table4: Schoolenrollmentofpersons3yearsandolder,1990 frompreviousyear,1980to1995 Table4 Percapitapersonalincomeinconstant1992dollarsandpercent changefrompreviousyear,1980to1995 1 MONTANA COUNTY STATISTICAL REPORT GALLATIN COUNTY POPULATION INCOME&POVERTY SOCIALINDICATORS GOVERNMENTFINANCES EDUCATION HEALTH&SOCIALSERVICES HOUSING AGRICULTURE EMPLOYMENT BUSINESS&INDUSTRY CompiledBy STATEDOCUMENTSCOLLECTION DAVIDR.MARTIN mav 9 ResearchSpecialist MONTANASTATELIBRARY TERRYMEAGHER HELEN1A5,15MEO.N6TtAhNAAVE5.3S20 Programmer/Analyst AdditionalProgrammingAssistanceBy JEANA.OLIVER Programmer/Analyst IssuedBy CENSUSANDECONOMICINFORMATIONCENTER MontanaDepartmentofCommerce 1424NinthAvenue Helena,Montana59620 (406)444-2896 FAX(406)444-1518 Copyright1996bytheCegns^umsan«da»Ecmono&m%ifc>®I>nformPa"t"i*oCn"Ce"nfterI SOW . Sumsf ''%;K**' ' MONTANACOUNTYSTATISTICALREPORT SECTIONONE: POPULATION CONTENTS Table 1.1: Area, 1990, andpopulation, 1890 to 1990 Table 1.2: Components ofpopulation change, 1980 to 1990- Table 1.3: Censuses and Intercensal estimates, 1970 to 1996 Table 1.4: Incorporatedplaces and census designatedplaces, 1980 and 1990 Table 1.5: Populationbyage, 1970 to 1990 Table 1.6: Populationbyrace andHispanic origin, 1970 to 1990 Table 1.7: Populationbyage, race and gender, 1990 Table 1.8: Populationby age, race and gender: percentages, 199 Table 1.9: Populationby age, Hispanic origin and gender, 199 Table 1.10: Populationbyurban and rural residence, 1980 and 1990 Table 1.11: Persons, households and families, 1980 and 1990 Table 1.12: Populationprojections, 1996 to 2020 GALLATINCOUNTYDATABASE POPULATION -TABLE1.1 - AREA, 1990,ANDPOPULATION, 1890TO1990 1990 1990 1990 POPULATION LANDAREA WATERAREA 1990 POPULATION %CHANGE (SQ.MILES) (SQ.MILES) POPULATION DENSITY* 1980-90 MONTANA 145,556.33 1,489.80 799,065 5.5 1.6 GALLATIN 2,506.85 25.88 50,463 20.1 17.7 1980 1970 1960 1950 1940 POPULATION POPULATION POPULATION POPULATION POPULATION MONTANA 786,690 694,409 674,767 591,024 559,456 GALLATIN 42,865 32,505 26,045 21,902 18,269 1930 1920 1910 1900 1890 POPULATION POPULATION POPULATION POPULATION POPULATION MONTANA 537,606 548,889 376,053 243,329 142,924 GALLATIN 16,124 15,864 14,079 9,553 6,246 *SEEAPPENDIXFORDEFINITIONS. ... =NOTAPPLICABLE;COUNTYWASNOTYETESTABLISHED. SOURCES: U.S.BUREAUOFTHECENSUS. 1990CENSUSOFPOPULATIONANDHOUSING,PUBLICLAW94-171 FILE(COMPUTERTAPE). U.S.BUREAUOFTHECENSUS. DECENNIALCENSUSESOFPOPULATION(TITLEVARIESPERCENSUS). PROCESSEDBYTHECENSUSANDECONOMICINFORMATIONCENTER,MONTANADEPARTMENTOFCOMMERCE DRM/JKW/TSM 1993 *** GALLATINCOUNTYDATABASE POPULATION *** -TABLE1.2- COMPONENTSOFPOPULATIONCHANGE, 1980TO1990 COMPONENTSOFCHANGE POPULATION CHANGE RESIDUALCHANGE* 1990 1980 PERSONS % BIRTHS DEATHS PERSONS % MONTANA 799,065 786,690 12,375 1.6 132,553 67,094 -53,084 -6.7 GALLATIN 50,463 42,865 7,598 17.7 7,179 2,465 2,884 6.7 *SEEAPPENDIXFORDEFINITIONS. SOURCES: U.S.BUREAUOFTHECENSUS. 1990CENSUSOFPOPULATIONANDHOUSING,PUBLICLAW94-171 FILE(COMPUTERTAPE). U.S.BUREAUOFTHECENSUS. 1980-90COMPONENTSOFCHANGEFILE(DISKETTE). U.S.BUREAUOFTHECENSUS. 1980CENSUSOFPOPULATIONANDHOUSING, SUMMARYTAPEFILE1 (COMPUTERTAPE). PROCESSEDBYTHECENSUSANDECONOMICINFORMATIONCENTER,MONTANADEPARTMENTOFCOMMERCE DRM/JKU/TSM 1993R
