ERIC ED537736: Third Grade Reading PDF
Preview ERIC ED537736: Third Grade Reading
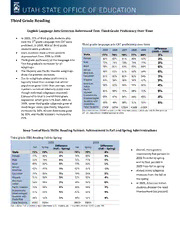
Third Grade Reading English Language Arts Criterion-Referenced Test: Third Grade Proficiency Over Time • In 2005, 77% of third-grade students who took the 3rd grade Language Arts CRT were Third grade language arts CRT proficiency over time proficient; in 2009, 80% of third-grade students were proficient. Difference 2005 2006 2007 2008 2009 (2005 – 2009) • State numbers show a three percent State 77% 78% 78% 77% 80% 3% improvement from 2006 to 2009. Female 80% 82% 81% 80% 83% 3% • Third grade proficiency on the Language Arts Test has gradually increased for all Male 73% 74% 74% 74% 77% 3% subgroups. Asian 78% 81% 83% 82% 84% 6% • The Hispanic and Pacific Islander subgroups African 58% 63% 61% 60% 64% 6% American show the greatest increases. Caucasian 81% 82% 82% 82% 84% 3% • Due to subgroups whose proficiency is Hispanic 53% 56% 56% 56% 62% 9% typically lower than average but whose American population grew faster than average, state 56% 62% 56% 55% 60% 4% Indian numbers remained relatively stable even Pacific 64% 69% 70% 68% 72% 8% though individual subgroups improved. Islander Compared to Utah’s overall third-grade Economically 65% 67% 66% 64% 69% 4% Disadvantaged population which grew 17% from 2005 to Students with 2009, some third-grade subgroups grew at Disabilities 48% 48% 48% 51% 55% 6% much larger rates; specifically, Hispanics Total Students 37938 39749 42004 43668 44309 increased by 36%, African-Americans grew Data is derived from a COGNOS analysis cube filtered by third graders, students who took the third grade LA by 31%, and Pacific Islanders increased by CRT, and tests without a modified participation status 23%. Iowa Test of Basic Skills: Reading Subtest: Achievement in Fall and Spring Administrations Third grade ITBS Reading Fall-to-Spring 2008 2009 Fall Spring Difference Fall Spring Difference (Fall – Spring) (Fall – Spring) • Overall, third graders State 75% 79% 5% 74% 79% 4% improved by five percent in Female 77% 80% 4% 76% 80% 4% 2008 from fall to spring Male 72% 78% 6% 72% 77% 5% and by four percent in Asian 80% 80% 0% 79% 80% 1% 2009 from fall to spring African 62% 67% 5% 62% 61% -1% American • Almost every subgroup Caucasian 79% 84% 5% 79% 84% 5% improves from the fall to Hispanic 51% 56% 5% 51% 55% 4% the spring American Indian 54% 56% 2% 48% 54% 6% • In 2009, American Indian Pacific Islander 70% 69% 0% 66% 69% 3% students showed the most Economically improvement (six percent) 61% 66% 5% 62% 66% 4% Disadvantaged Students with 48% 53% 5% 48% 52% 4% Disabilities Total Students 39061 39694 39659 39859 Data is derived from a COGNOS analysis cube filtered by full academic year third graders who took the third grade ITBS
